Case Selection in a Tax Administration: Managing Risk
One of the advantages associated with collecting a large amount of information is that it can be used to determine patterns of behavior. One of the most common forms of use is through a Risk Matrix, which, taking registration information, declarations and third party information, among others, determines the risk of non-compliance through a polynomial calculation. This risk can be defined as:
$$ Matrix = (Risk; Quantity)$$
Where:
- \( Risk = \sum\limits*{i=1}^n{a_i p_i} \)
- \( Quantity = \max\limits*{i=1}^n{(v_1)} \)
- \( p_i \) is the terms weight
- \( a_i \) is the risk associated to a particular case
- \( v_i \) is the monetary amount of the case
- \( n \) is the number of cases
- \( i \) is the count of cases
Provided the following conditions are met :
- \( \sum\limits_{i=1}^n p_i = 1 \)
- \(0 \leq p_1 \leq 1 \)
In this context, it is necessary to determine the types of data that can be part of the polynomial since they should be part of an ITAS:
- Registration data, which are those that normally constitute systemic risks, since they do not imply specific behavior on the part of the taxpayer. These data can be differentiated into:
- catalog data, in other words, those in which there are a finite number of possible elements, to which a fixed value is assigned. An example in this sense is the type of taxpayer, which in its most basic name includes only Individual and Corporate.
- Segmentation data, or those that are segmented into ranges or bands that have predefined values and are assigned a value based on them.
- Return data, which are perhaps the most widely used.
- Third party data, given by the difference between the value declared by the taxpayer and the value reported by the third party.
- Behavioral data, referring to the actions of the taxpayer in the tax administration. These usually include:
- number of cases in collection management
- number of audit cases that resulted in an increase in the amount to be paid
- number of cases in which the taxpayer declared the expiration date of the obligation passed.
It is then possible to assign each taxpayer a risk value made up of two elements: the probability that said taxpayer is in default and its value, calculated as the monetary difference that could arise if the default were to materialize. In this way, we can represent risk on the Cartesian plane, where Y represents the probability of default and X the monetary difference. Then, the risk matrix is the binary relationship (X and Y) of the risk values of each of the taxpayers for a given period, with the highest risk representing the highest probability and the highest monetary difference. If they are assigned to fixed spans, you can get something like the figure below, where the darkest spans are the riskiest.
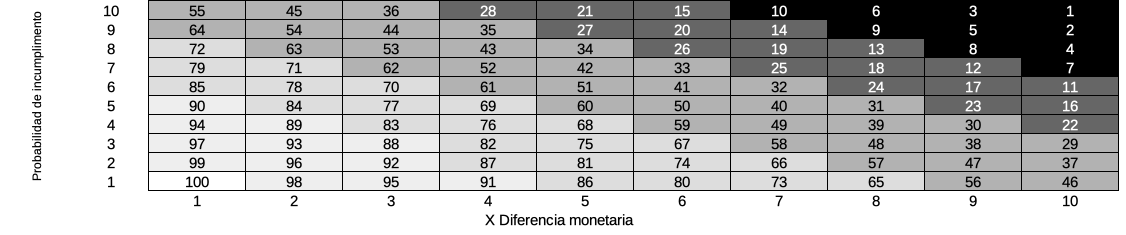
Risk Matrix Representation in the Cartesian plane
However, having the taxpayers segmented is not enough. In the example shown in the previous figure at the end, there will be a number of taxpayers in each section that makes a good report, but more can be done. For example, if tasks are assigned to each of them, then ITAS can make decisions and initiate actions without human intervention, greatly improving overall performance and simplifying the overall case selection process. If we define that for sections 1 to 10 (the most risky) a complete audit will begin, for sections 11 to 28 a verification and for sections 29 to 55 a basic verification (and mostly computerized of their situation), we will have much of the work done. Of course, nothing prevents the definition of actions in other areas of the TA if it is considered pertinent, for example sections 65-72 are assigned as administrative collection cases, as long as the organizational framework allows it.
Now, it is interesting to note that much of the selection work lies in defining the algorithm’s operating parameters, which, being general, limit arbitrariness to a great extent and encourage transparency, but at the cost of having enough information about the taxpayer to take the best possible decisions and a detailed study that allows coupling with the proposed audit plan. In other words, it is useless, for example, to have a polynomial of the type \(Risk = Financial Institution * 0.5 + No Past Defaults * 0.5 \) if the number of taxpayers is minuscule and they have been recently audited. Nor is a polynomial of the type \(Risk = Lawyers * 0.5 + Accountants * 0.5 \) useful if the registry does not have external information, for example from the respective professional associations to validate the economic activity.
A recurring theme in the implementation of a Risk Matrix consists of the distrust that initially generates a poor selection of cases (or in other words, not very interesting) based on errors in the information. In these cases - and until the cleanup of the information is finished - it is true that perhaps uninteresting cases can be selected from the point of inspection, but as they are completed, the percentage of interesting cases will grow as the information quality and organizational experience reach the appropriate level, so that without a doubt all cases are - in some way - interesting or useful for the audit function.
As can be seen, the success of the Risk Matrix depends to a great extent on the information available in the ITAS, the quality of that data, external sources of information and a deep knowledge of the taxpayer base. On the other hand, once these obstacles have been overcome, it can be assumed that the definition of the risk polynimio is carried out together with the audit planning and then at the end of the period the results are controlled.